LabPlot Data Analysis and Visualization Software

118 readers
4 users here now

KDE's data visualization and analysis software. LabPlot is free, open source, works on Linux, WIndows and macOS, and is accessible to everyone.

Share here your tips, tricks and resources, request help, talk to the maintainers and devs, read LabPlot news, connect with other users.

founded 2 years ago
MODERATORS
1


Dear LabPlot colleagues, May I kindly ask if it is possible to generate a graph similar to the visualisation on the screenshot? For one variable (penicillin), I've been trying to visualise the results of measurements from different laboratories. Thank you already in advance. Best, Michael

P.S.: Would be nice to have the designation of laboratories (A-K) included in the graph (either in the symbols as in my visualisation, or alternatively next to them), but this is optional.

P.P.S.: The scientific context is antimicrobial susceptibility testing, i.e. if a bacterium is susceptible and can thus be treated by the antibiotic (indicated by a big zone diameter, measured in millimeters [mm]) or resistant (small zone diameter).

2


Update: Fixed in 2.11.1-4

Was a packaging issue. Solved within one hour after creating a bugreport. Many thanks to the incredible team!

I run Arch (btw) with KDE plasma using the wayland session.

Today I ran into labplot2: error while loading shared libraries: liborcus-0.18.so.0: cannot open shared object file: No such file or directory

I got the same error for libixion-0.18.

For both libraries I had version 20 something installed.

Is this currently broken? Did anyone else run into the same problem? Libreoffice which also uses liborcus has no problems so I assume it was a Labplot issue. Will file a bugreport as soon as I have a KDE account :D

Workaround: I got it to work by creating symlinks form version 18 -> 20

3


Hello!

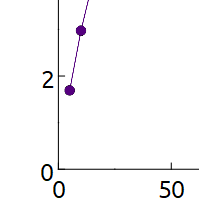
I've been using LabPlot for a year aproximately and now I need to prepare some plots for a paper. However, I cannot find information on how to put just only one 0 in the axis intersection when both axis begin in 0. ¿Is there a way to erase one of them or to configure the plot so only one origin is shown?

Thank you

4
1
submitted 10 months ago* (last edited 10 months ago) by Stitch0815@feddit.org to c/labplot@lemmy.kde.social


Hi all,

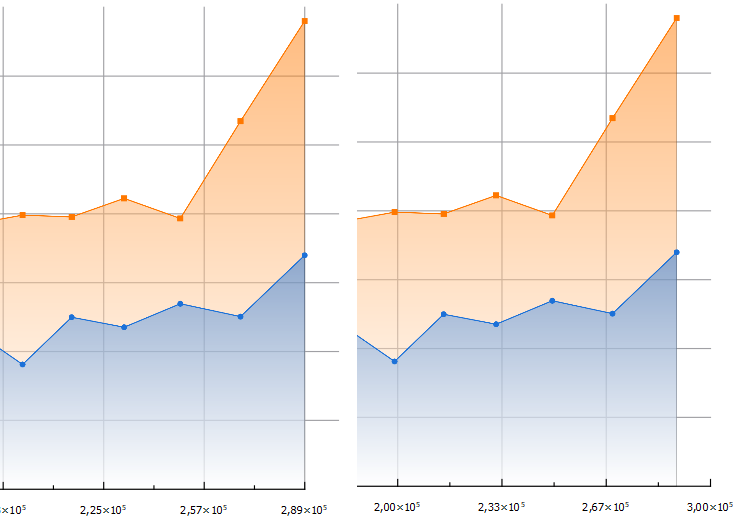
I just started using labplot. Mainly for visualization so far. I am currently plotting stuff in a line plot. For some reason I cannot figure out how to properly align my x-axis. If I reduce the data range my gridlines overextend. If I increase the x-axis range the axis just extends over my data.

Anyone know how to make this fit.

Sorry for the basic question but I have been banging my head against this for 2 days now and just can't figure it out.

If you have some good material beside the videos and documentation I am also happy to just take a link.

Thanks :)

edit: I use LabPlot 2.10.0 on Windows

5
1
submitted 2 years ago* (last edited 2 years ago) by labplot@lemmy.kde.social to c/labplot@lemmy.kde.social


An easy and quick way to get up and running with LabPlot.