This makes my eyes bleed
this post was submitted on 27 Feb 2025
384 points (97.8% liked)
Data Is Beautiful
8040 readers
1 users here now
A place to share and discuss data visualizations. #dataviz
founded 4 years ago
MODERATORS
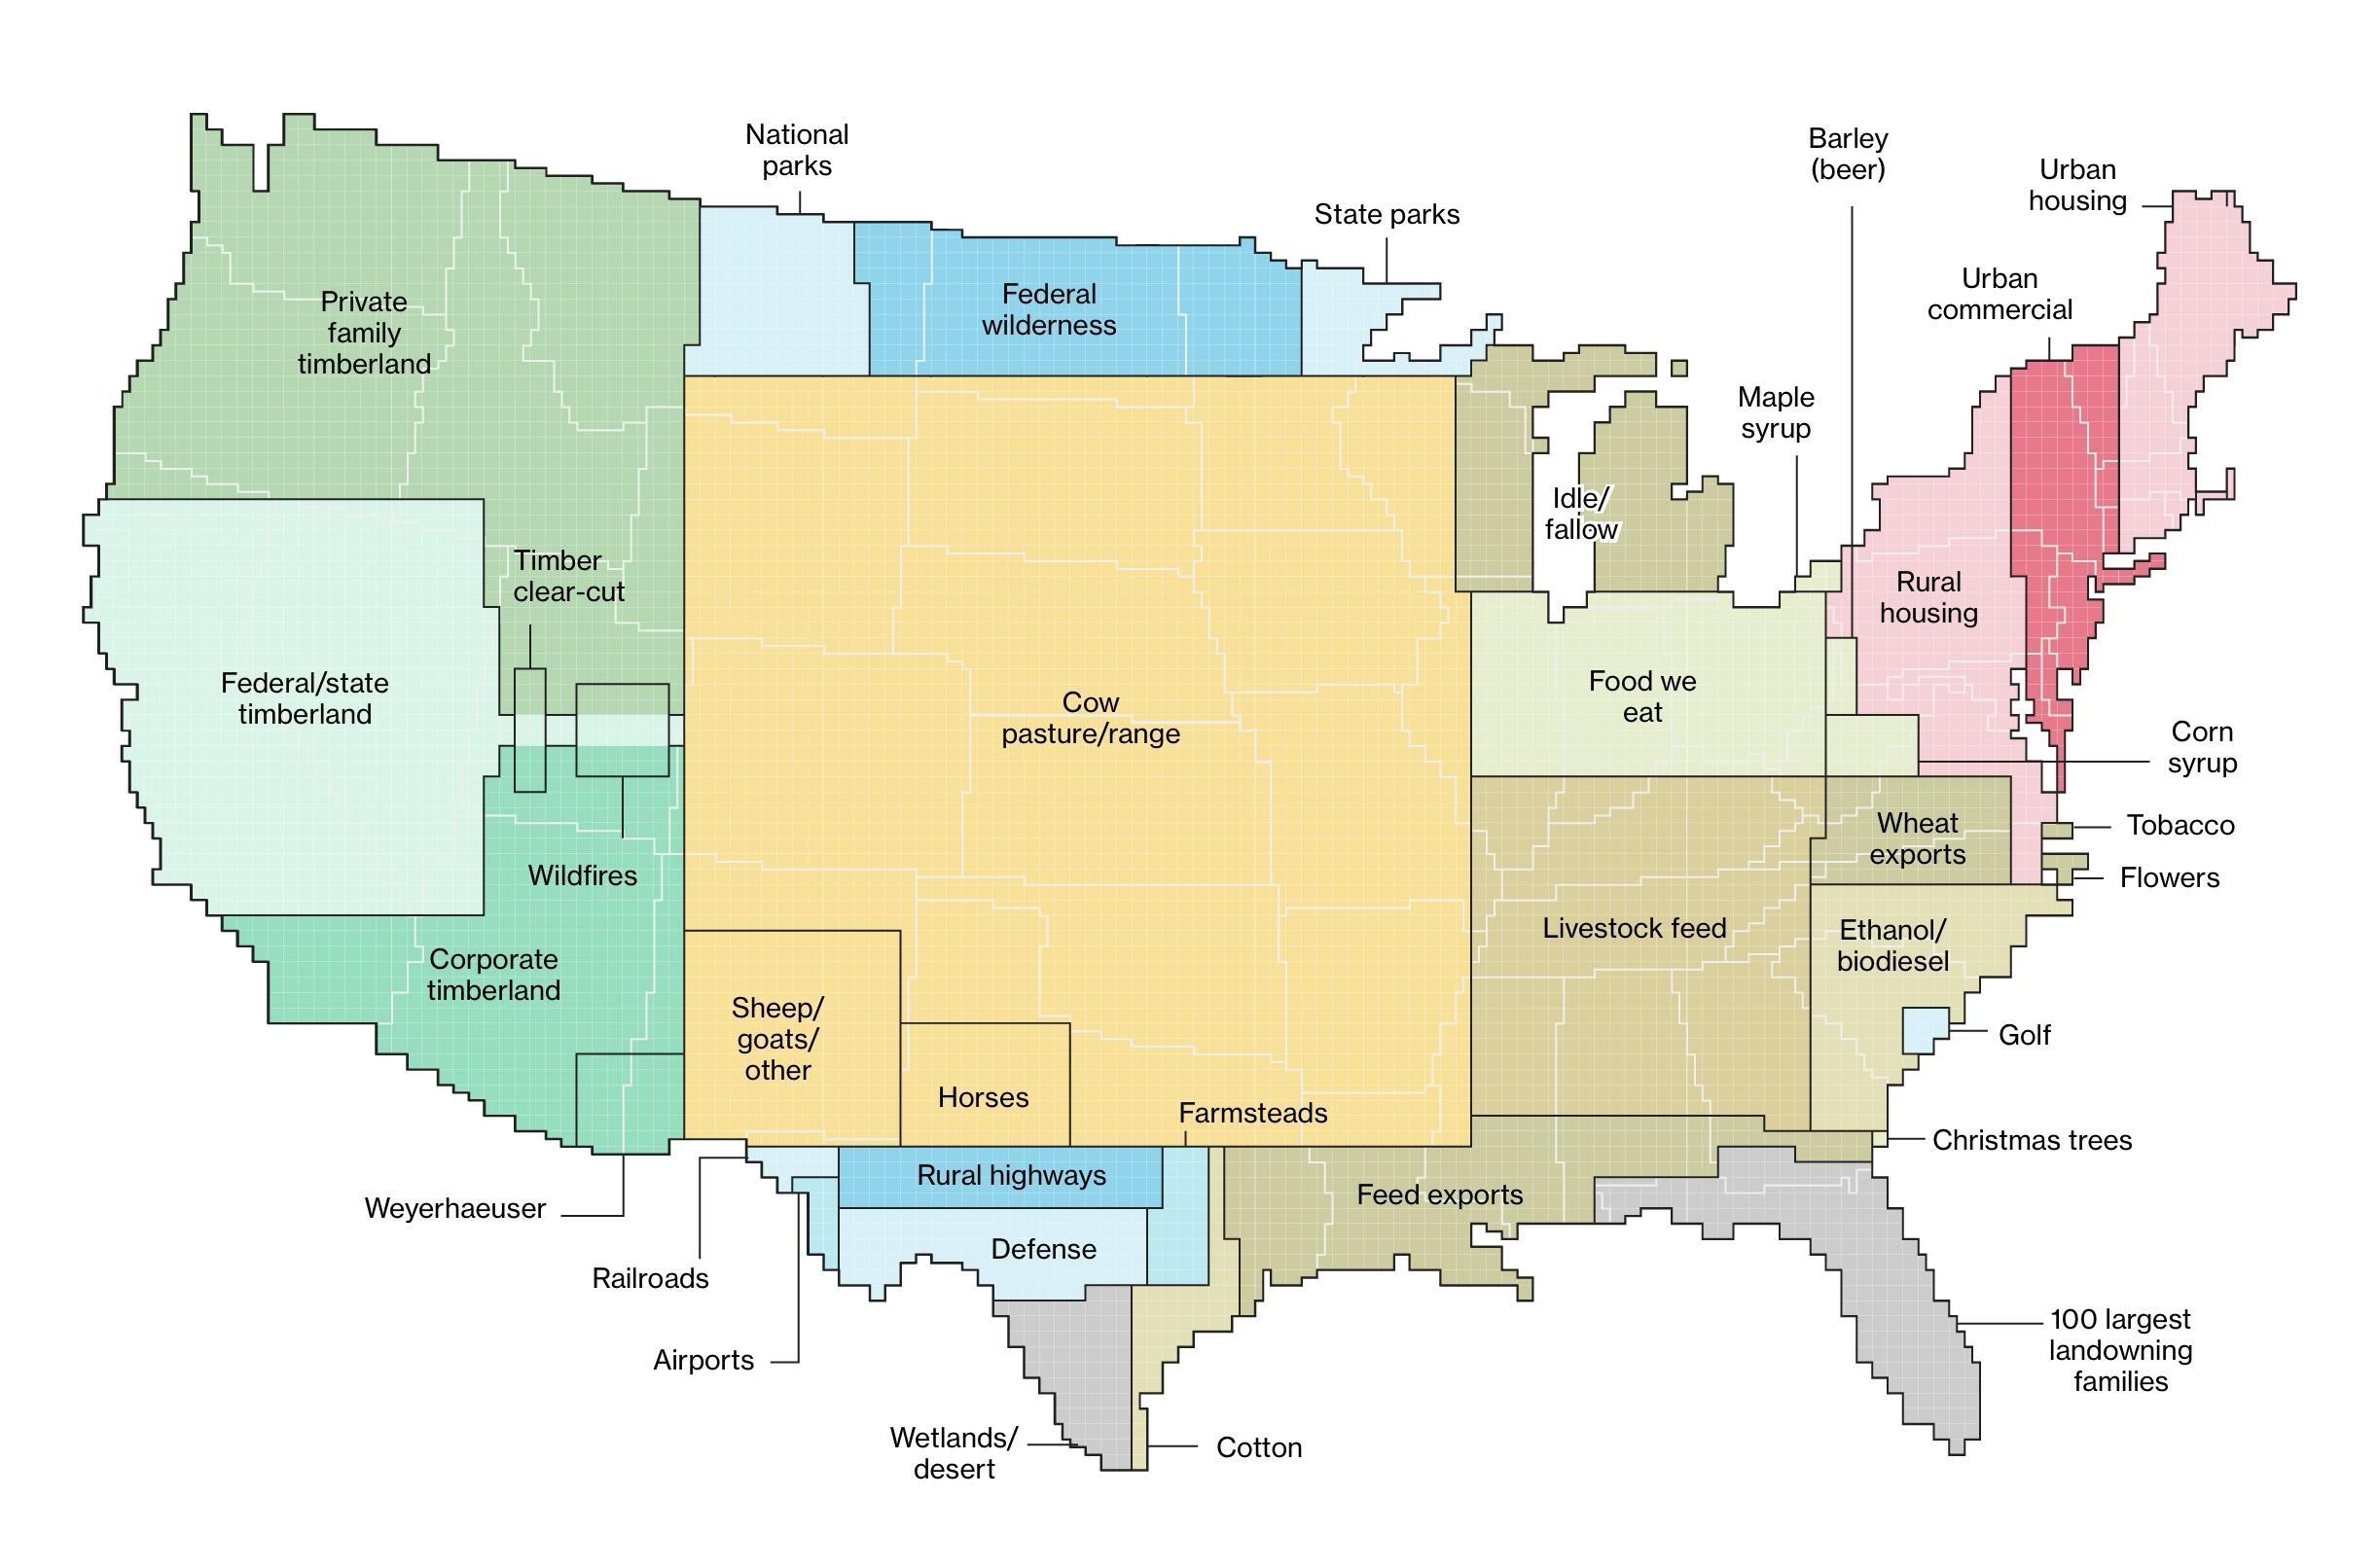
I think the graphic would be better if some of the data were nested by size and relationship. IOW Agricultural land would have grazing, food production, feed production, etc. in decreasing size nested over an area. Might give greater sense of how much land is used for ag. Same for forestry; Forestry, parks, commercial logging, etc.
Tobacco is still at least 2,000x too big.
God I miss living in the west.
No, we use it to vote.
hugging the west coast, there are tons of cow farms, and a small part of cali is for the military, SEAL training.
Yeah Maine is so well known for it's urban housing
And Nevada for its timberland.
is Alaska included? or are we just ignored because of our small population?
load more comments
(1 replies)