1
Data Is Beautiful
10091 readers
1 users here now
A place to share and discuss data visualizations. #dataviz
founded 5 years ago
MODERATORS
2
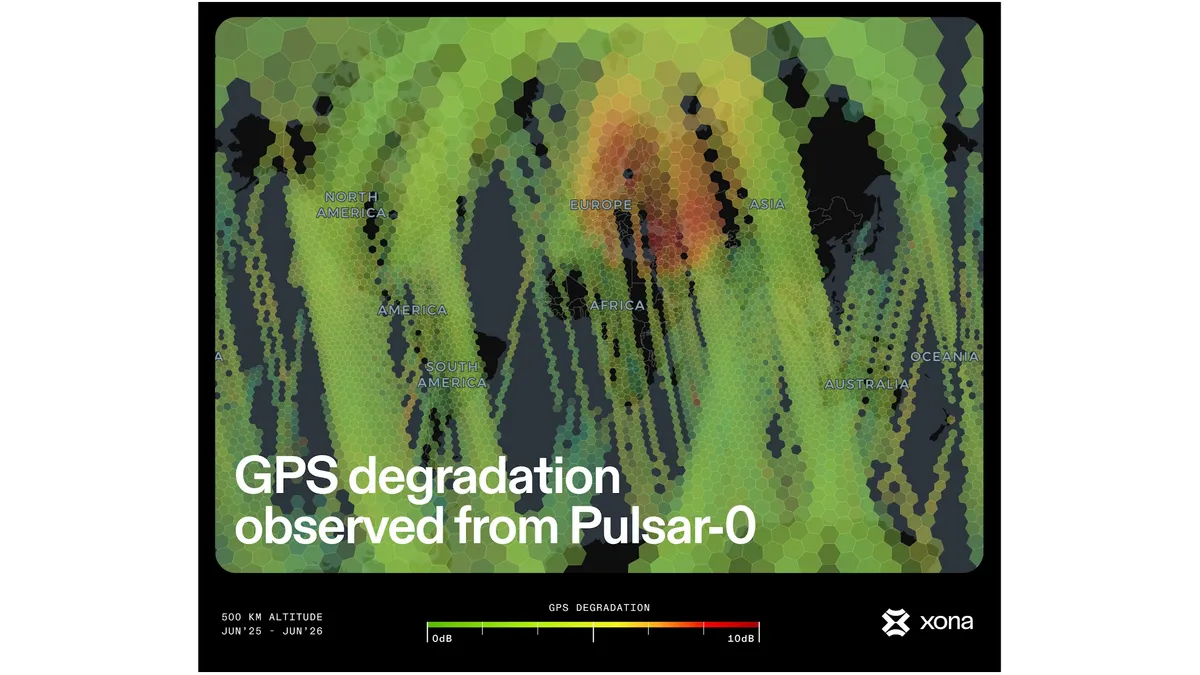
I made these for a recent conference I was particularly happy with the way these came out.
And the fire ones:

3
4
5
6
7
8
9
10

12
13
14
38
How Many Episodes Should You Watch Before Quitting a TV Show? A Statistical Analysis
(www.statsignificant.com)
16
17

18
19
20
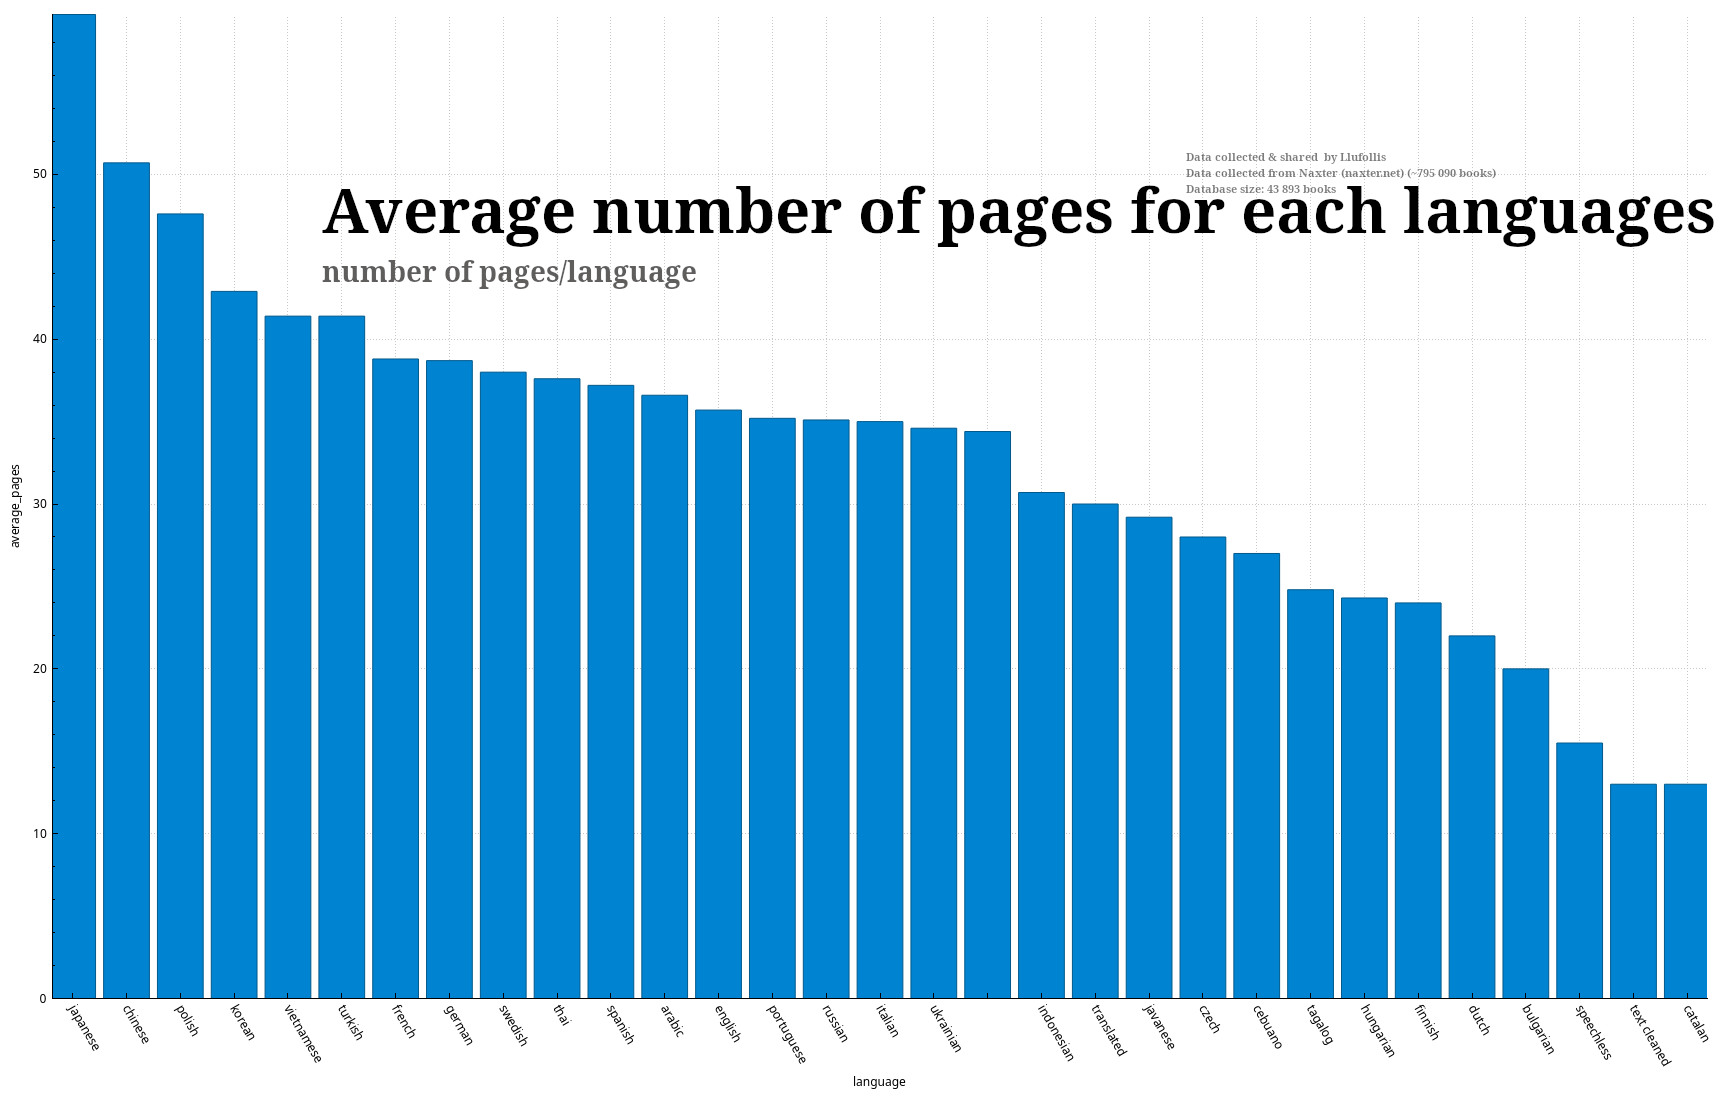
- These data are publicly available, I just "rearranged" them in a database I created.
- Understand these data as trends, not reality, there is billions of erotics comics/hentais out there and my database only hold 43 893 of them.
- I am not a data analyst. These values do not hold a real value and I can have made errors.
I have a LOTS more data I can share like: most popular characters/parodies/tags, etc.
I do NOT encourage any of you to read erotic comics/hentais. I personally don't but I though these data might be interesting.
21
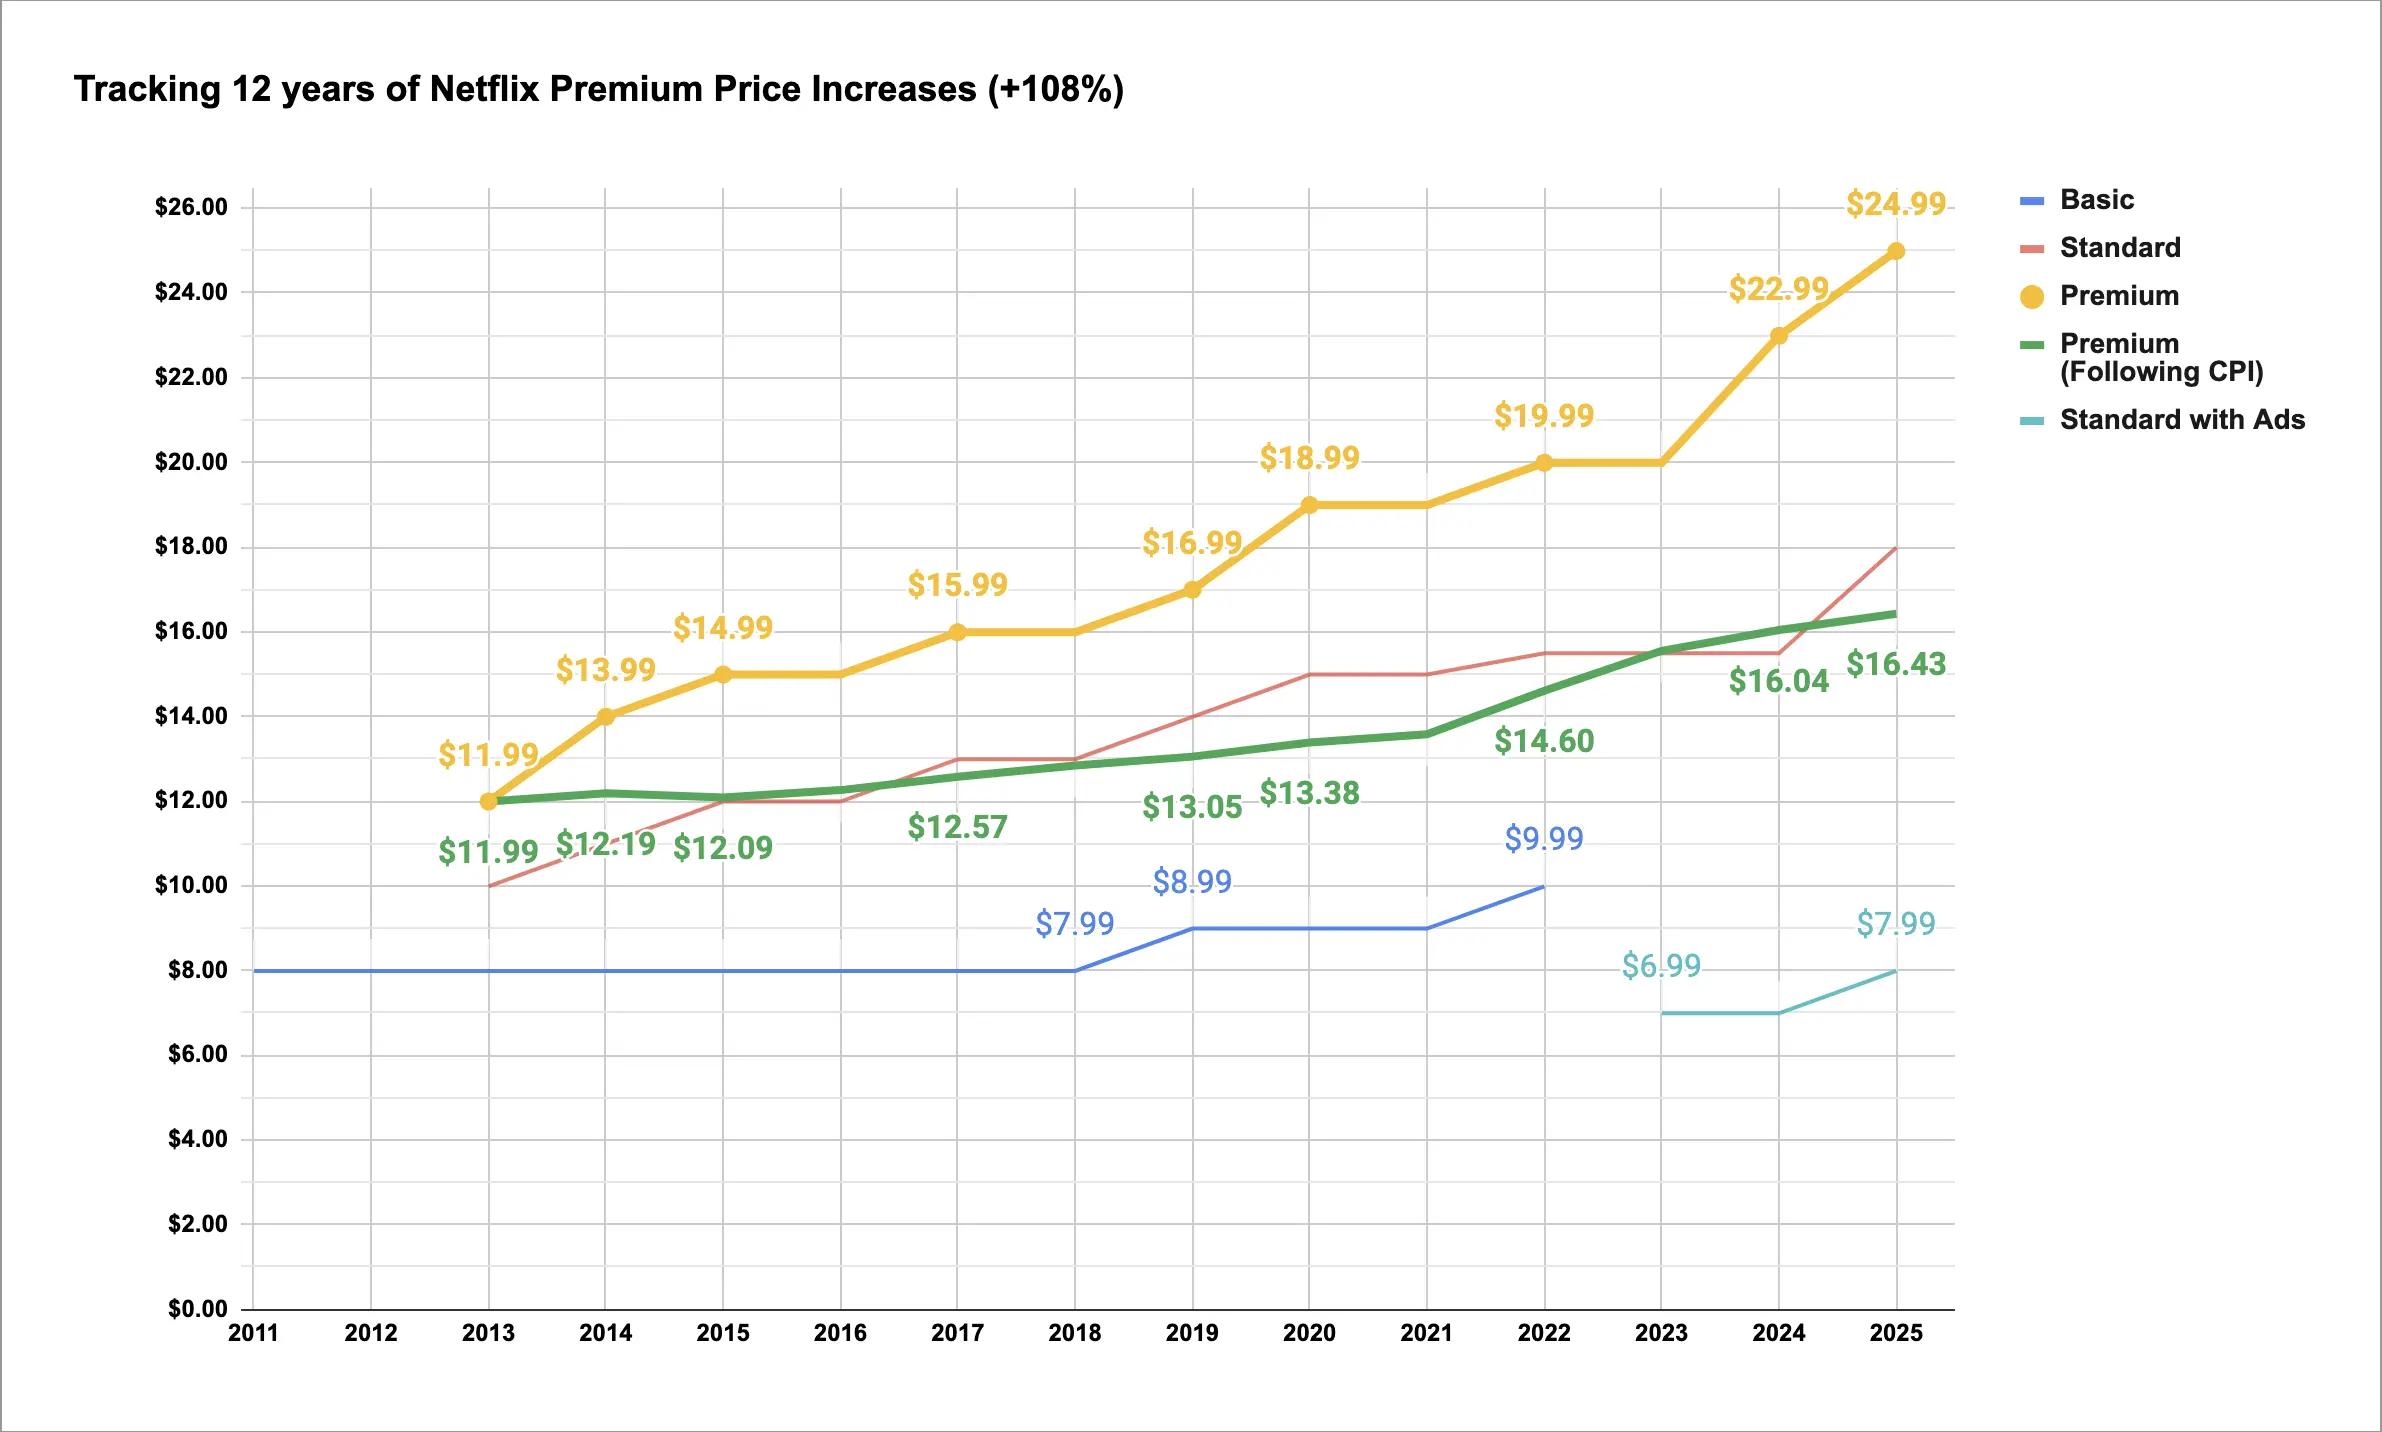
CPI taken from https://www.bls.gov/data/inflation_calculator.htm
I fudged the CPI calculation a bit because I didn't do the compounding monthly, but I ensured that based on the CPI calculator, the starting value of $11.99 -> $16.43 from January 2013 -> December 2024.
To be fair, I think CPI is somewhat bullshit, but it was the easiest .gov source for inflation data that I knew about.
Data:
| Year | Basic | Standard with Ads | Standard | Premium | Premium Following CPI | CPI Inflation % |
|---|---|---|---|---|---|---|
| 2011 | $7.99 | - | - | – | - | - |
| 2012 | $7.99 | - | - | – | - | 1.60% |
| 2013 | $7.99 | - | $9.99 | $11.99 | $11.99 | 1.58% |
| 2014 | $7.99 | - | $10.99 | $13.99 | $12.19 | -0.89% |
| 2015 | $7.99 | - | $11.99 | $14.99 | $12.09 | 1.37% |
| 2016 | $7.99 | - | $11.99 | $14.99 | $12.26 | 2.50% |
| 2017 | $7.99 | - | $12.99 | $15.99 | $12.57 | 2.07% |
| 2018 | $7.99 | - | $12.99 | $15.99 | $12.84 | 1.55% |
| 2019 | $8.99 | - | $13.99 | $16.99 | $13.05 | 2.49% |
| 2020 | $8.99 | - | $14.99 | $18.99 | $13.38 | 1.40% |
| 2021 | $8.99 | - | $14.99 | $18.99 | $13.58 | 7.48% |
| 2022 | $9.99 | - | $15.49 | $19.99 | $14.60 | 6.41% |
| 2023 | Phased Out | $6.99 | $15.49 | $19.99 | $15.55 | 3.09% |
| 2024 | – | $6.99 | $15.49 | $22.99 | $16.04 | 2.33% |
| 2025 | – | $7.99 | $17.99 | $24.99 | $16.43 | - |
edit: Zeroed y axis
23
view more: next ›