Be respectful
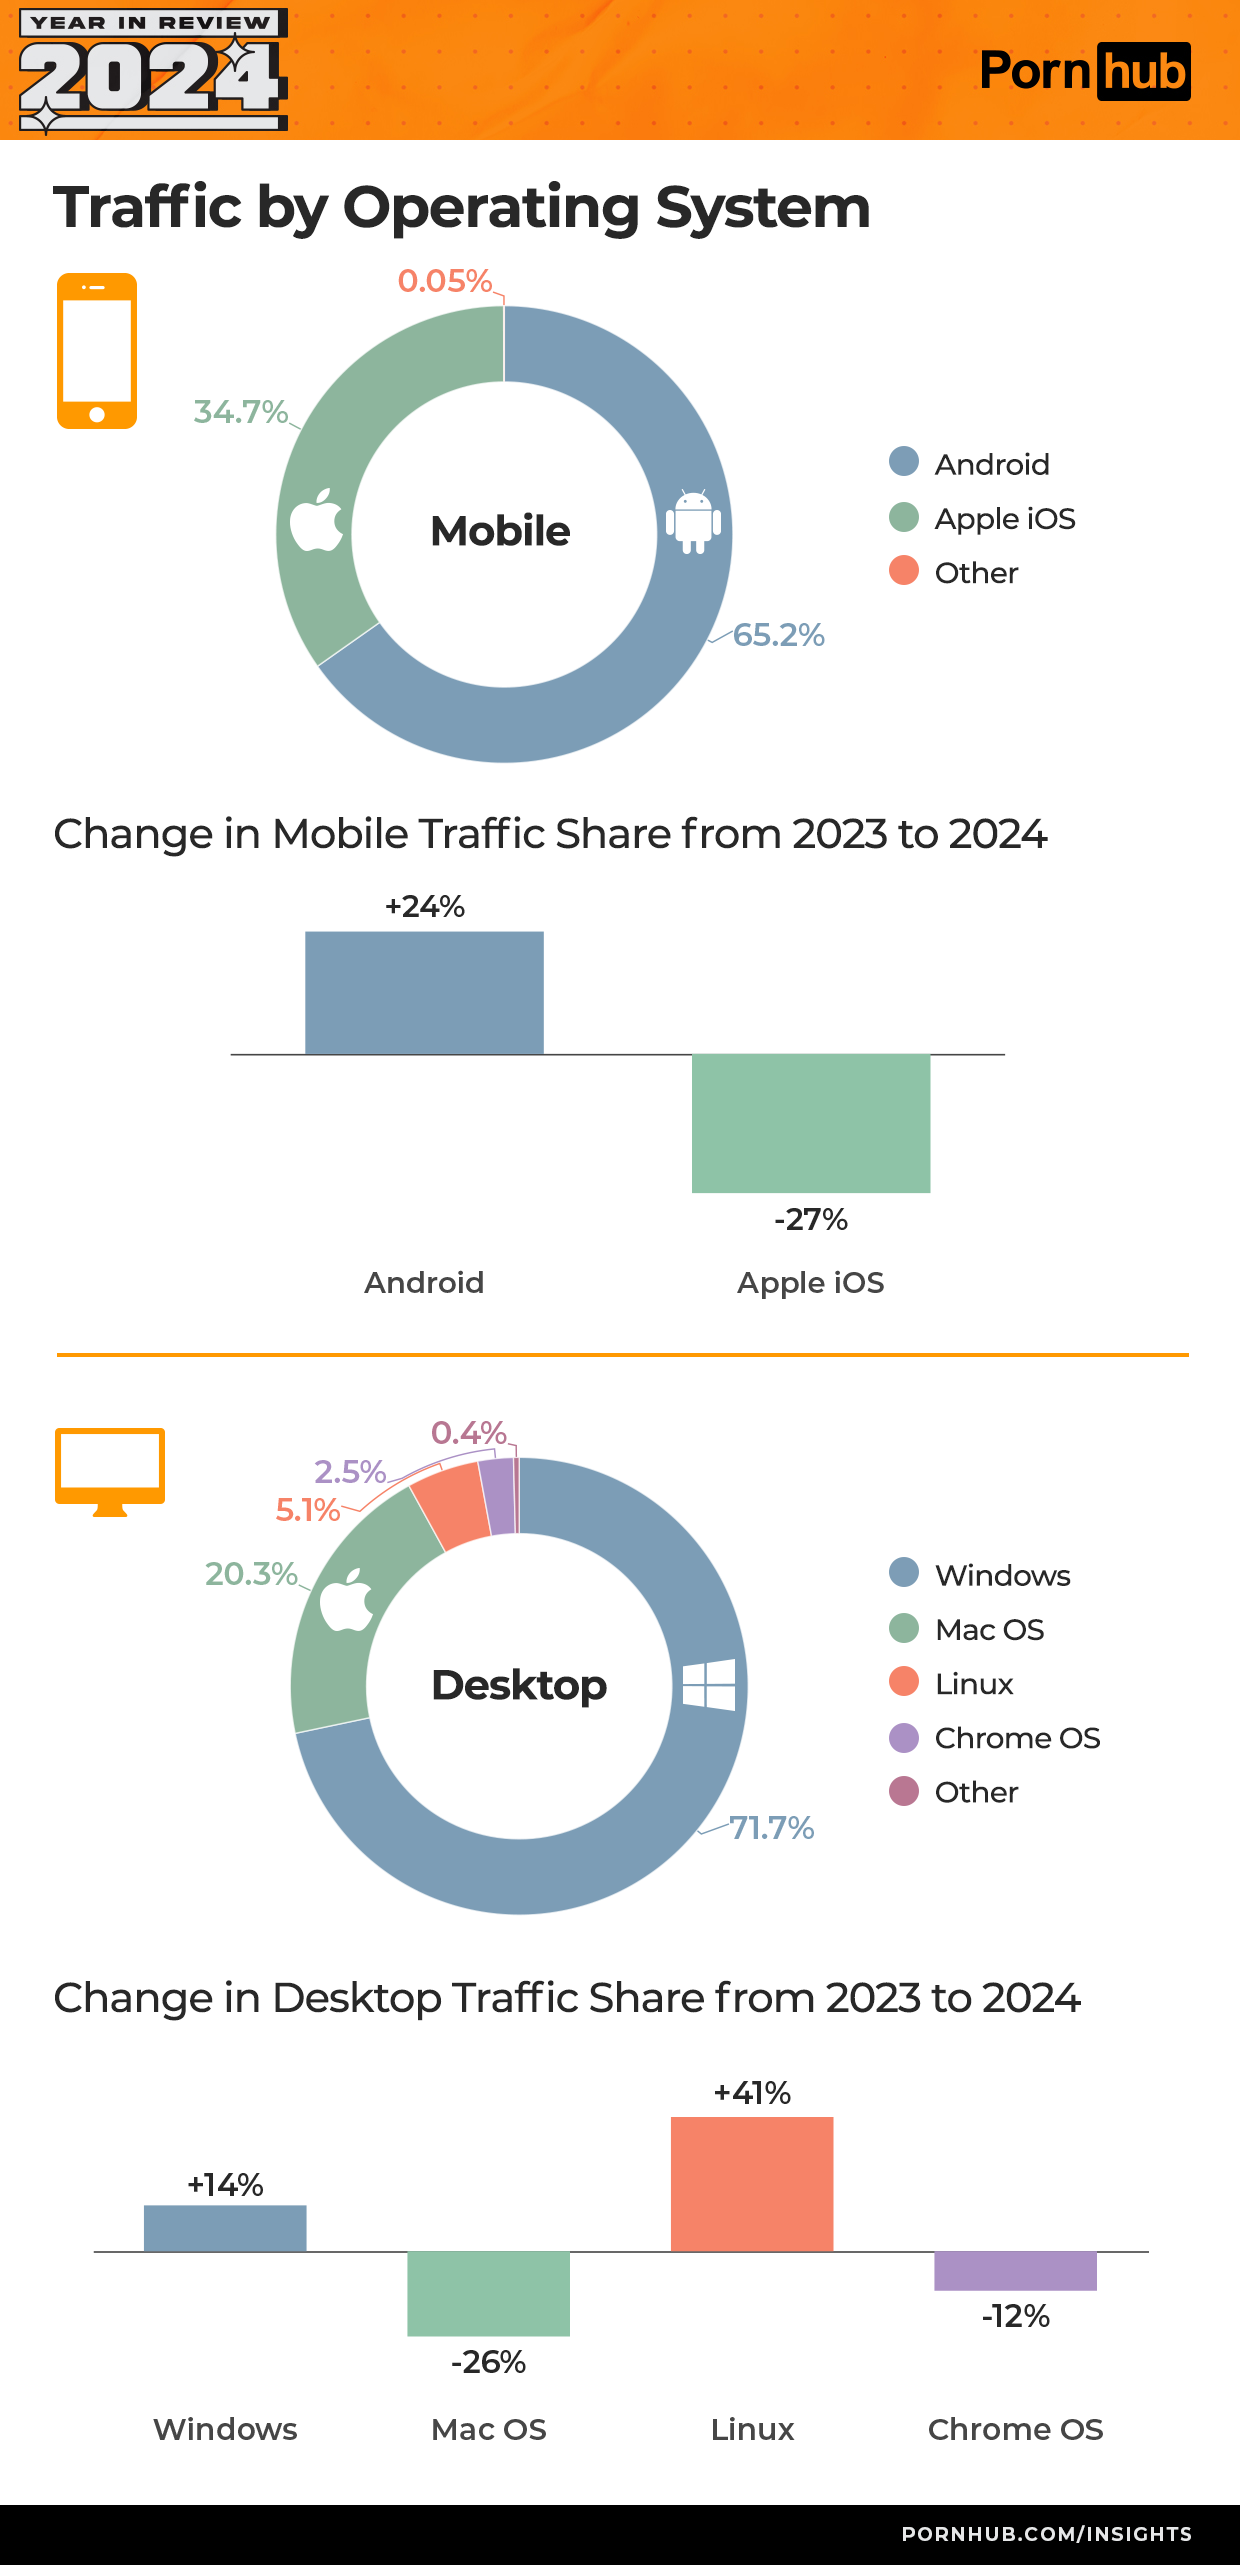
We reached 5.1% market share!
We need to grow that 0.5%!
A line graph shows proportional change over time inherently. "50% growth" isn't something that ever justifies being presented as the focus of a graph of any sort.
A line graph shows proportional change over time inherently. "50% growth" isn't something that ever justifies being presented as the focus of a graph of any sort.