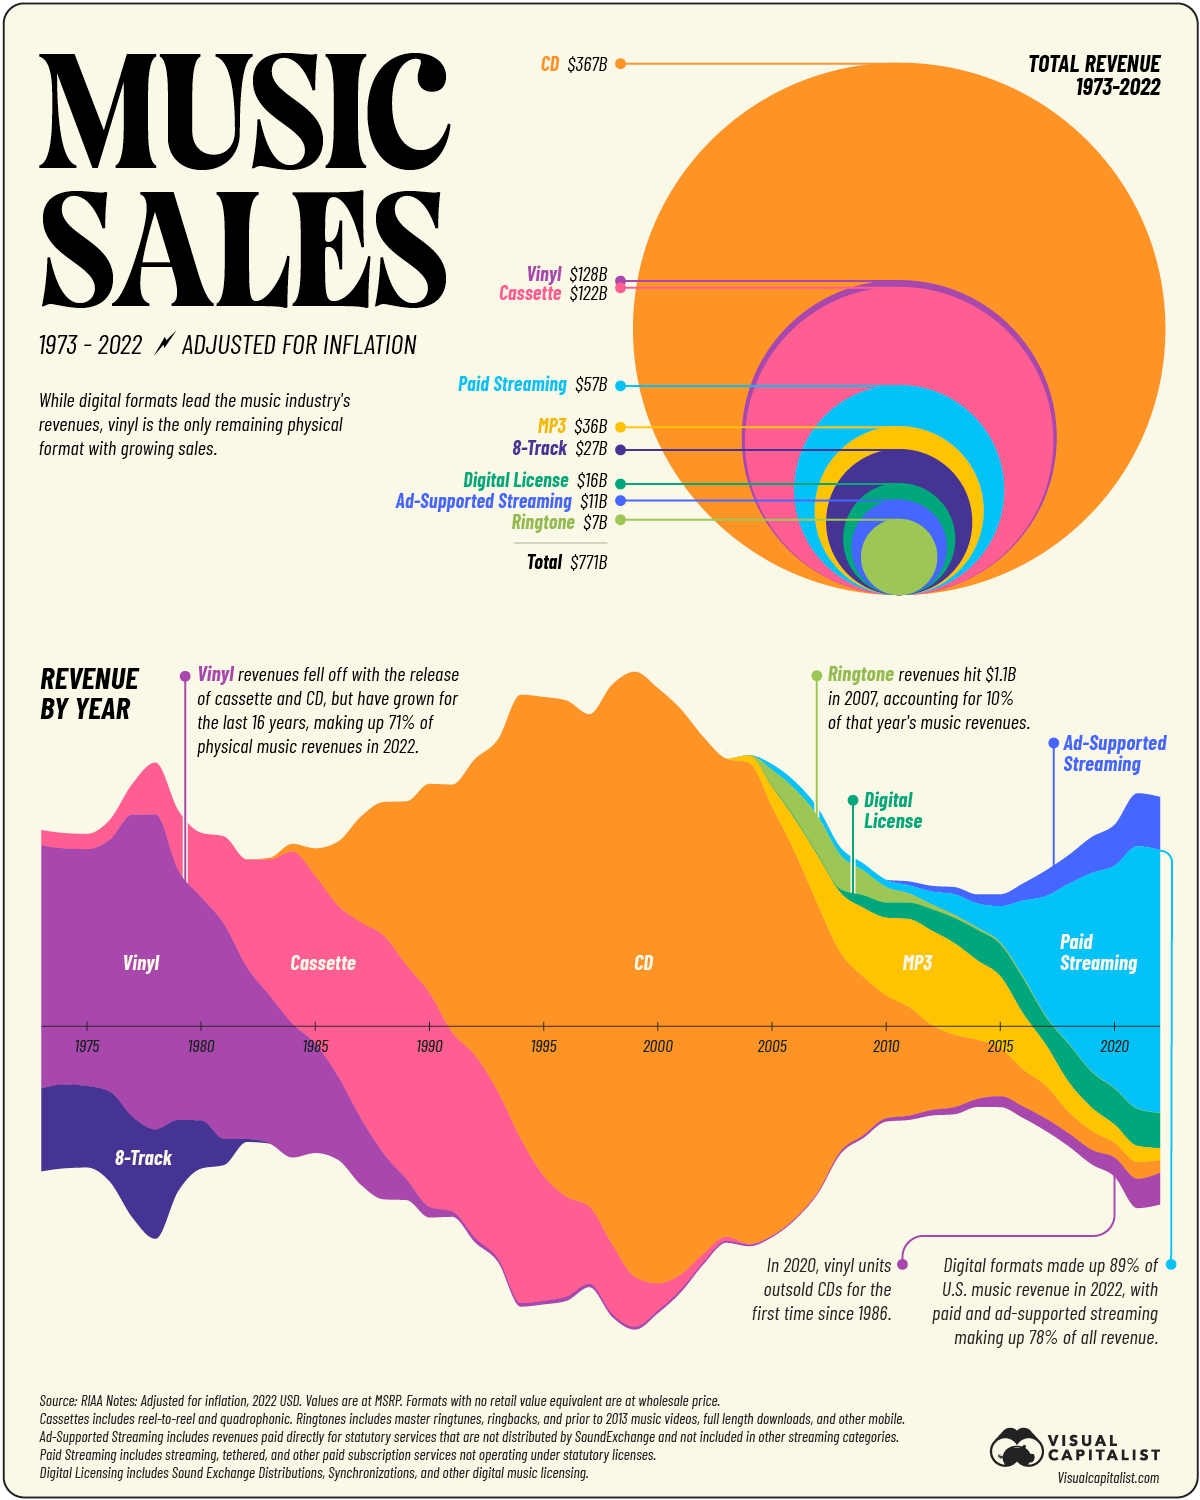
Am I the only one who is totally confused by the lower plot? How is the data distributed among the positive and negative y axis? Is the negative portion supposed to be negative annual revenue? Why are CDs then in the positive and negative at the same time. I desperately need more labeling or explanation please. It sure looks nice, but I'm completely at loss...
How is the data distributed among the positive and negative y axis?
It's symmetrical. There is actually nothing negative shown in that graph. The graph could be flat at the bottom on the axis that it would change nothing. However, it looks like soundwaves.
Am I the only one who is totally confused by the lower plot? How is the data distributed among the positive and negative y axis? Is the negative portion supposed to be negative annual revenue? Why are CDs then in the positive and negative at the same time. I desperately need more labeling or explanation please. It sure looks nice, but I'm completely at loss...
It's symmetrical. There is actually nothing negative shown in that graph. The graph could be flat at the bottom on the axis that it would change nothing. However, it looks like soundwaves.