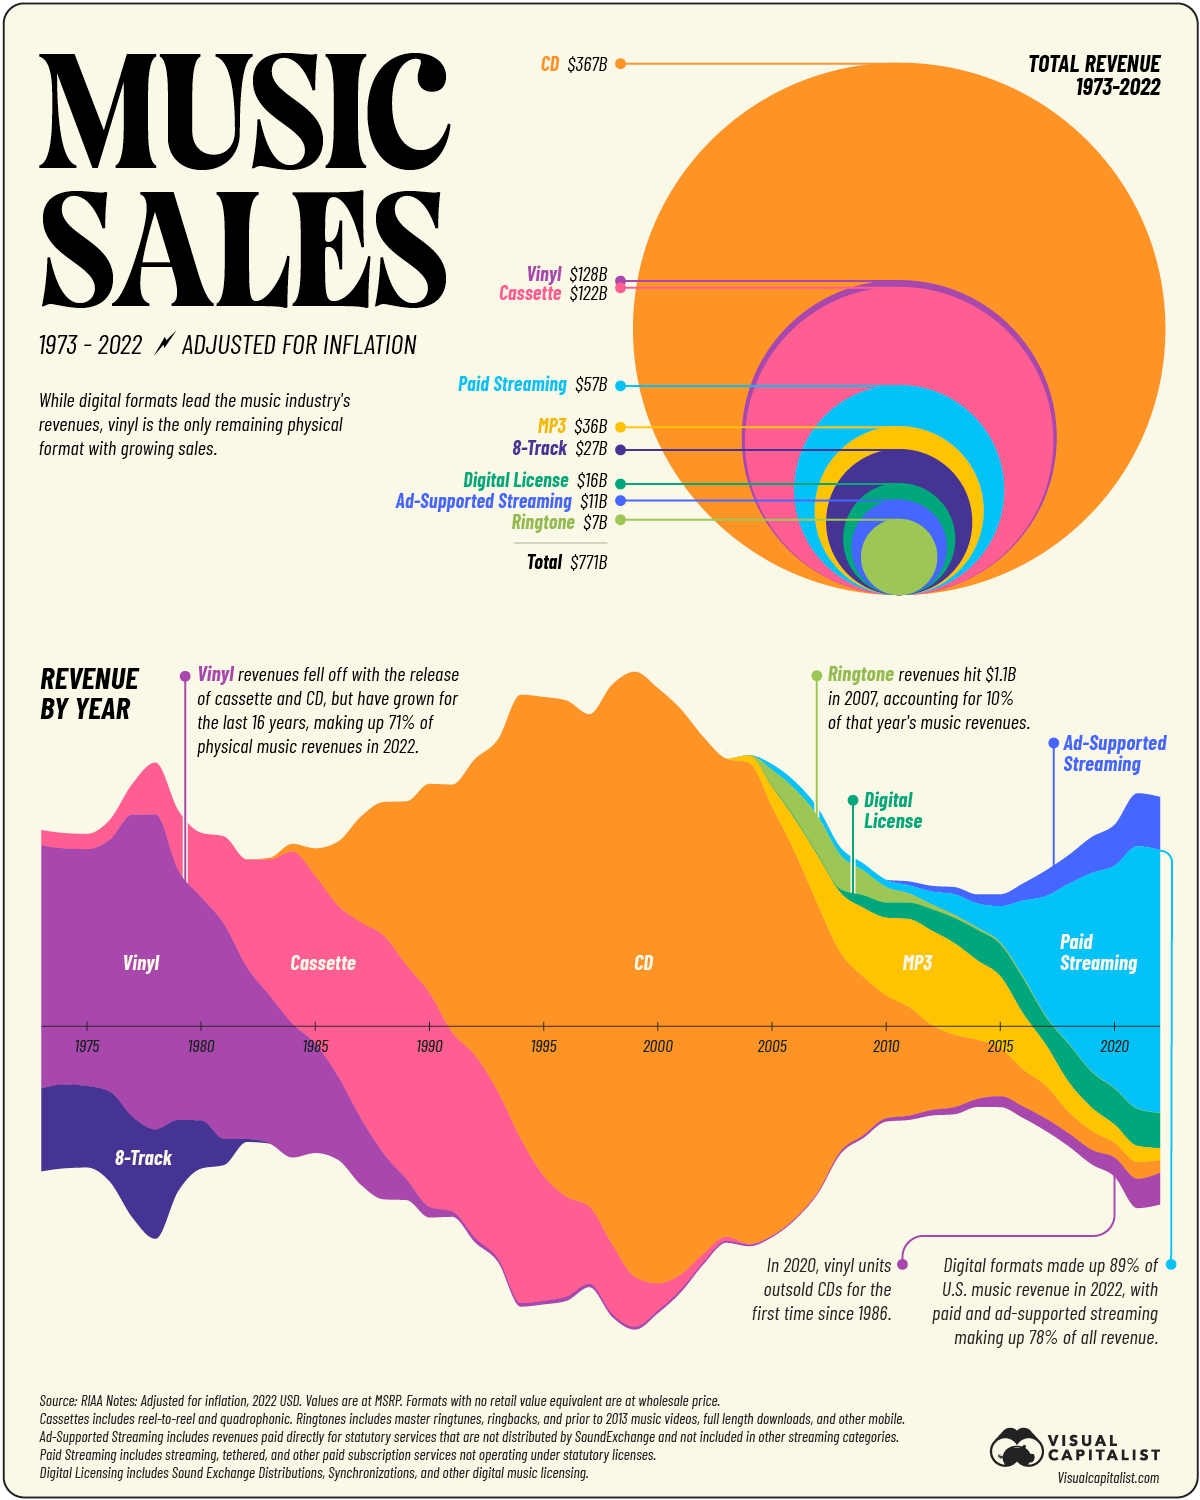
How is the data distributed among the positive and negative y axis?
It's symmetrical. There is actually nothing negative shown in that graph. The graph could be flat at the bottom on the axis that it would change nothing. However, it looks like soundwaves.
It's symmetrical. There is actually nothing negative shown in that graph. The graph could be flat at the bottom on the axis that it would change nothing. However, it looks like soundwaves.