Physics

1962 readers
3 users here now

founded 4 years ago
MODERATORS
1
2


I've been looking for some good simulations of spring-mass networks with customizable parameters. Those I find are usually fairly simple, with uniform masses and springs, each connected at right angles to adjacent masses (i.e. six connections from each face in a cube setting, which is the most complex simulation I could find). I would like to explore the dynamics of a less uniform system, i.e. the effect of a large mass with many connections to smaller masses, how those smaller masses respond if they are more interconnected, etc. So I was wondering if anyone has some suggestions for a good simulation tool that they may have stumbled upon during some coursework or similar? I am in particular interested in the visual representation of the time evolution of such a system, so some kind of tool that generates an animation would be ideal.

Is my best bet perhaps to use the physics engine of e.g. the Godot game engine (Jolt physics) or whatever solver is used in Blender?

3


Generally whenever I am packing objects for moving or storage, I ensure that the smooth side of one item faces the smooth side of the other. E.g. if I have a box of old smartphones or tablet PCs, putting the faces together to have screen against screen (and no debris of course) works well. No need for individual wrapping.

Ceramic tiles from the shop are always boxed facing the same direction. It seems every single factory is doing this without exception. The rough ceramic bottom is stacked against the smooth glazed side.

So when storing excess spare tiles for future repairs, I restack them smooth side against smooth side. But for one batch of tiles the stack was a bit rocky - less stable. Whereas the original stack of all facing the same direction does not rock. Apparently they are less flat or less symetric than they appear.

Is glass harder than ceramic? Or did they decide that compromise is better than a risk of fractures due to the lack of flatness?

IIUC, the bottom of a tile is 6.5—7 Mohs and glass is softer. But different kinds of glass are different and I don’t know where the glaze of a ceramic tile stands on that scale. IIRC, glaze on ceramics is a kind of glass, or at least glass-like.

4


The authors found that peak water levels in both floods occurred around 1 to 2 weeks after peak river discharge during perigean spring tides when both the Sun and Moon are in optimal positions to create high tides. They hypothesize that peak river discharge rates suppress subharmonic tidal amplitudes, while intermediate rates of discharge allow for greater amplitudes and therefore higher water levels. Additionally, river water takes some time to fully move downstream, meaning that water levels are higher in the days following floods, adding to the effects of tidal inflows.

5
6
7
8


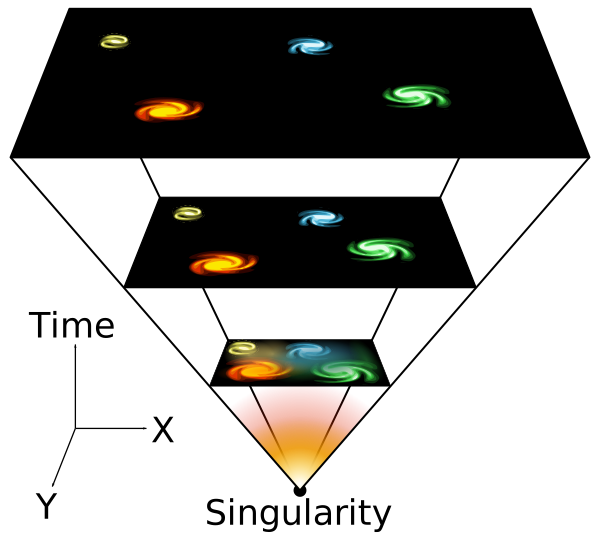
This illustration shows abstracted "slices" of space at different points in time. It is simplified as it shows only two of three spatial dimensions, to allow for the time axis to be displayed conveniently.

Author: Fredrik

CC BY-SA 4.0

9


A representation of the evolution of the universe over 13.77 billion years. The far left depicts the earliest moment we can now probe, when a period of "inflation" produced a burst of exponential growth in the universe. (Size is depicted by the vertical extent of the grid in this graphic.) For the next several billion years, the expansion of the universe gradually slowed down as the matter in the universe pulled on itself via gravity. More recently, the expansion has begun to speed up again as the repulsive effects of dark energy have come to dominate the expansion of the universe. The afterglow light seen by WMAP was emitted about 375,000 years after inflation and has traversed the universe largely unimpeded since then. The conditions of earlier times are imprinted on this light; it also forms a backlight for later developments of the universe.

Author: NASA/WMAP Science Team

10
 
 
  1. Objective lens
  2. Oocular (eyepiece)
  3. Eye
  4. Object (at a large distance)
  5. Real Image of the object at the focal plane of the objective lens (here, a film or CCD detector could be placed for photographing the object)
  6. Virtual Image of the object (as it appears to the eye)
  7. Tube

Author: Michael Schmid

CC BY-SA 2.0 at

11


Diagram showing how primary and secondary rainbows are formed due to the light propagation in spherical droplets.

  1. Spherical droplet
  2. Places where internal reflection of the light occurs
  3. Primary rainbow
  4. Places where refraction of the light occurs
  5. Secondary rainbow
  6. Incoming beams of white light
  7. Path of light contributing to primary rainbow
  8. Path of light contributing to secondary rainbow
  9. Observer
  10. Region forming the primary rainbow
  11. Region forming the secondary raimbow
  12. Zone in the atmosphere holding countless tiny spherical droplets

Author: Peo

CC BY-SA 3.0

12


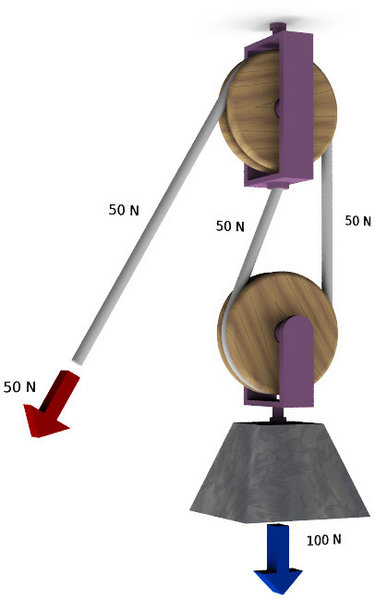
A gun tackle has a single pulley in both the fixed and moving blocks with 2 rope parts dividing the load of 100N. The mechanical advantage is 2, requiring a force of only 50N to lift the load.

Author: César Rincón
CC BY-SA 3.0

13


Author: Bartosz Kosiorek

CC BY-SA 3.0

14


Author: Nina Hernitschek

CC BY-SA 2.5

15
 
 
16
17
18
19


cross-posted from: https://sopuli.xyz/post/47499904

For bridges, the nearest-term opportunity is likely magnetic inspection. My team and I co-authored a review, which has not yet been peer-reviewed, on quantum magnetometers for infrastructure inspection. These sensors identify signals from induction responses, magnetic flux leakage, stress, corrosion and operational currents.

In plain terms, these sensors may help map weak magnetic fields near steel, cables or electrical conductors. Changes or disruptions in these local magnetic fields can reveal hidden rust, snapped wire strands inside a thick suspension cable, or abnormal stress points in the steel before a crack even forms.

https://arxiv.org/abs/2604.03288

20
21
22
23
24
25
view more: next ›