104
Does it harm the global proletariat to fight for improved conditions in the imperial core?
(hexbear.net)
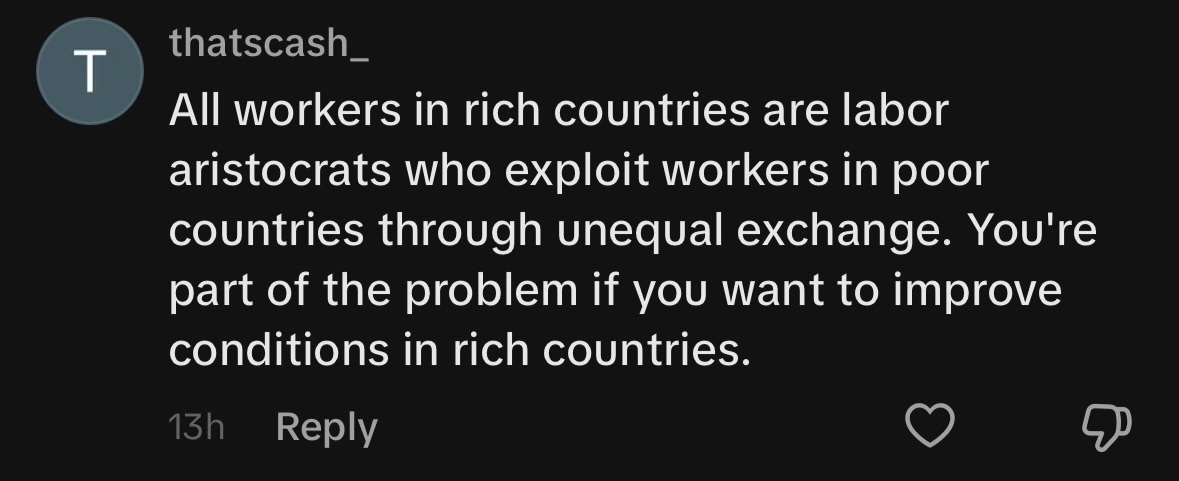
Saw this comment on the commie side of TikTok. My gut tells me this is ultraleft bs, but perhaps my fellow hexbears can educate me on this discussion which I’m sure is not new.
I don’t see how a poor American on food stamps is responsible, even though a systematic analysis reveals that international superexploitation is a thing.
The American proletariat can and should organize in any case. I don’t see how Americans can build any sort of socialist movement if any organization at all is accused of being hypocritical.
This is not how averages work.
There is a global average (mean) wealth per capita. Some countries have wealth above the average, and most have wealth below the average. Any change in the internal inequality does nothing to change this: the average of 50k and 60k is 55k, and the average of 10k and 100k is also 55k.
For the mean American wealth to be below the global average would require America as a whole to be losing wealth to other countries, and for the Netherlands and Germany and Sweden to be below average, with Spain and Italy above average. That's why the map didn't look very believable.
A bar chart that shows the 50th, 90th, and 99th percentile of wealth in selected countries would be a lot more informative in this case.
The infographic makes sense if it refers to median instead of mean. Changing wealth distribution does change median wealth.
The infographic cites the Credit Suisse Global Wealth Databook 2019^1, I think specifically Table 2-4.
Page 130, section 4.2 states that the global wealth per adult (mean) is $70,850 for mid-2019. To recover the numbers from the bottom map in the infographic, look in Table 2-4 for the median wealth per adult.
As an example, the infographic has the Philippines becoming 26x wealthier. Table 2-4 shows mid-2019 median wealth of $2,618. Computing the numbers, (70850-2618)/(2618) gives 26. Indonesia, with a median wealth of $1,977, works out to 35x — same as the infographic.