Some real beautiful data graphs in this paper
Source: https://doi.org/10.1016/S0140-6736(24)02317-1
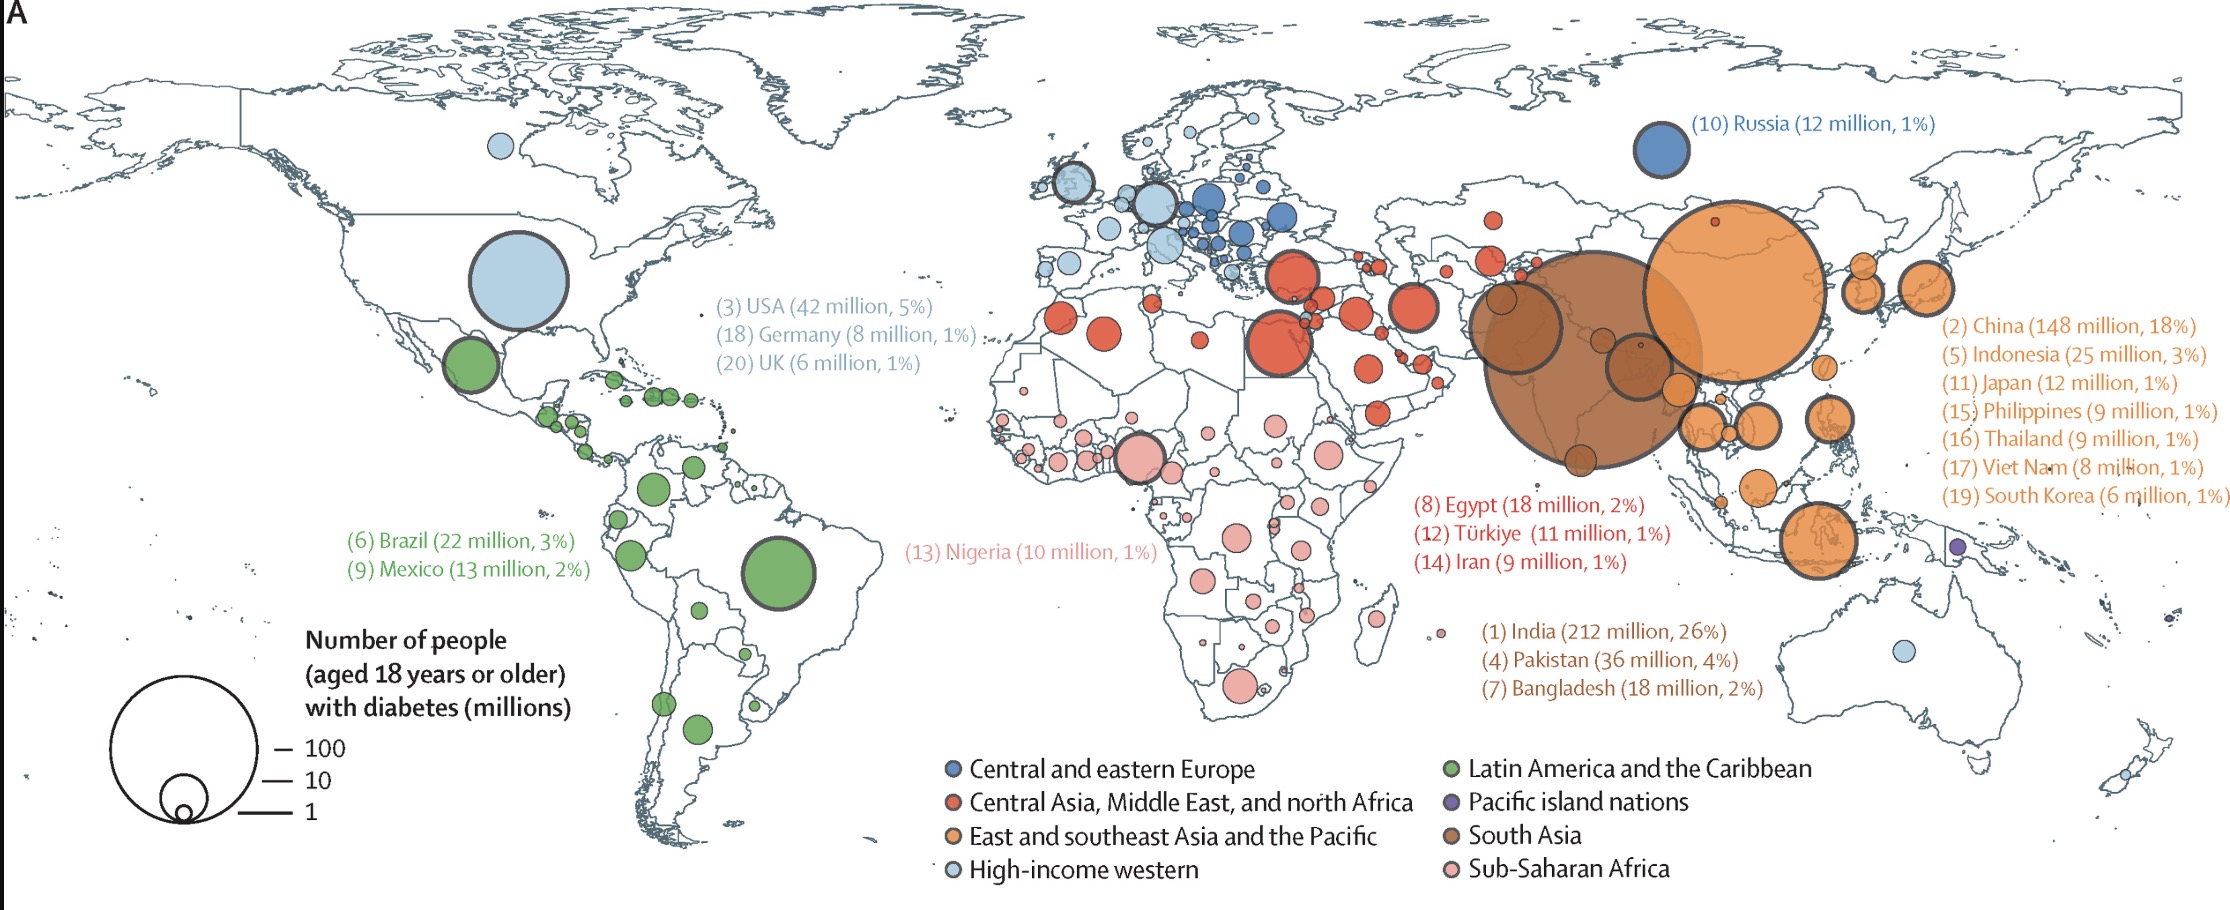
The Top 4 Countries by rate:
- India 26%
- China 18%
- USA 5%
- Pakistan 4%
This is only accounting for tracked diabetes, so some of the areas might have larger numbers.
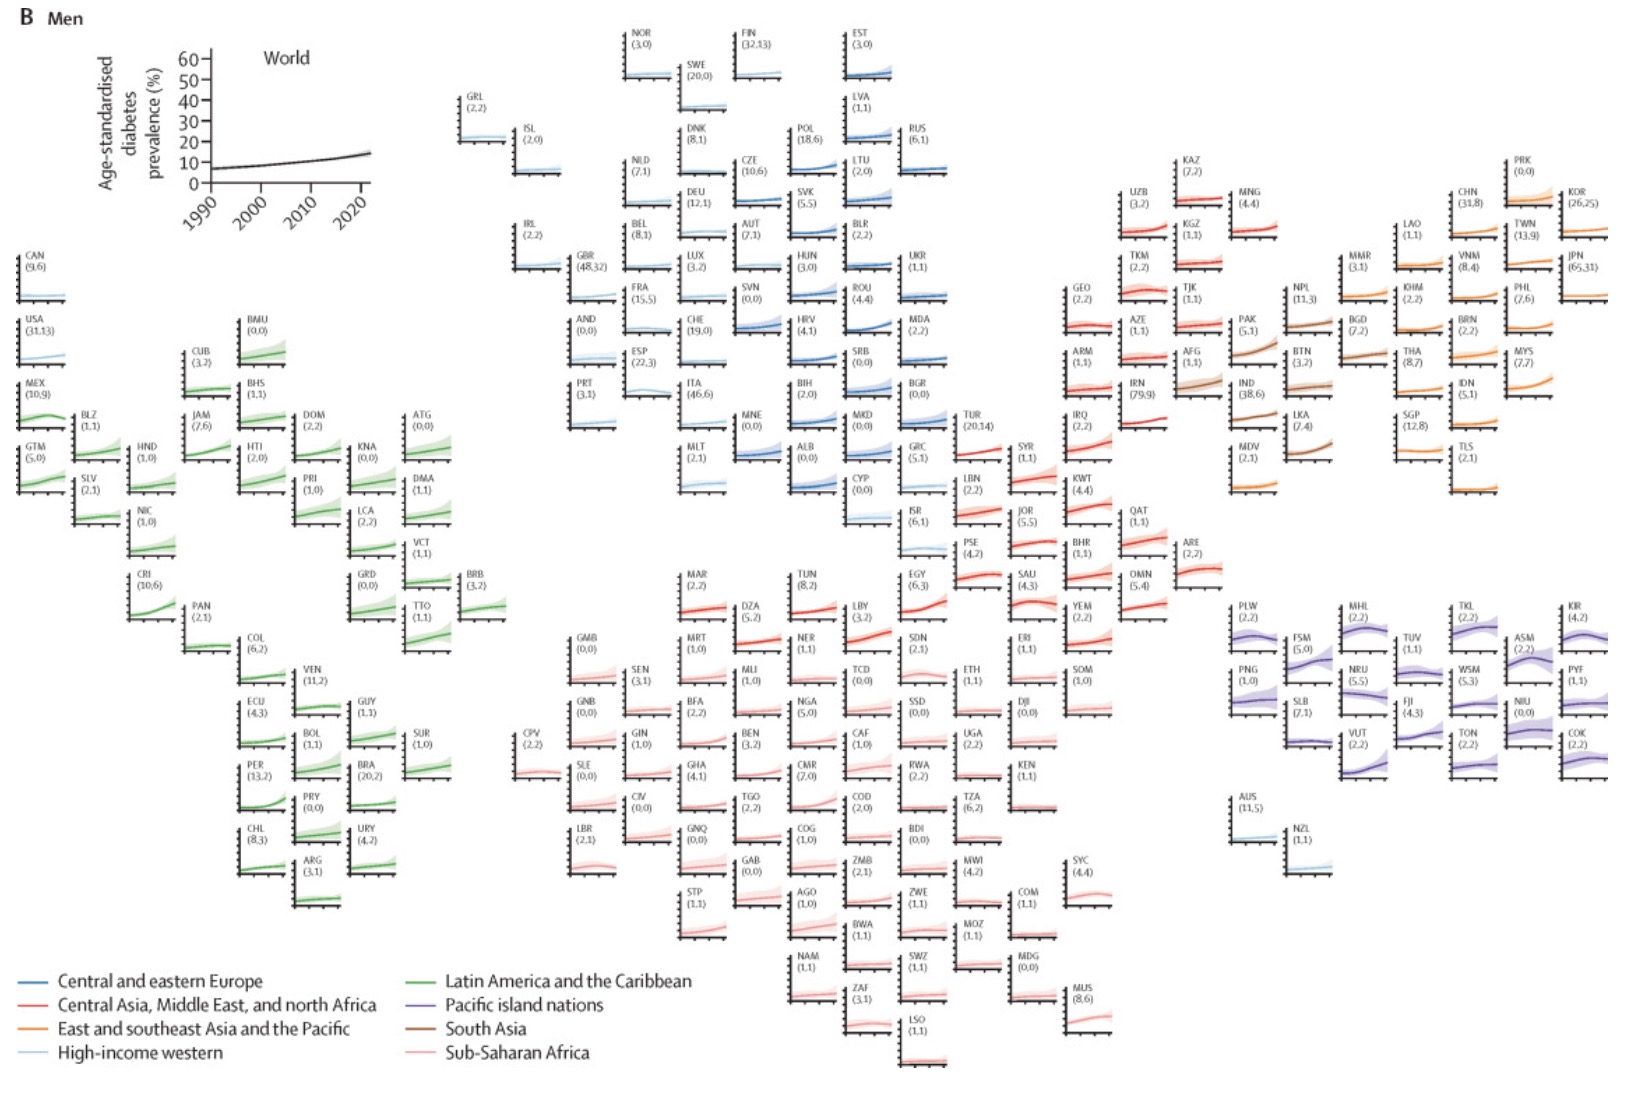
So what the hell is going on in India and China? 26 % and 18% are huge numbers compared to the usual 1% in the rest of the world.
Yeah, that is a puzzle.
India does have a very large vegetarian population, which means they have a high carb diet, which is a necessary component of T2D.
That doesn't explain China, china is the puzzle. I've seen a theory that the only major dietary change in China is the proliferation of industrial cooking oils which does increase insulin resistance in mice.
Yeah, it's around a fifth of the population. There must be something seriously wrong there. Like something not found anywhere else but widespread in those countries.
Europeans tend to have hyperplasic fat, and Asian tend to have hypertrophic fat. Meaning a European can get much fatter then a asian before the REALLY BAD THINGS start to happen. That might be a variable
It could also have something to do with white rice, if consumption in India exceeds that in otherwise similar countries.
By the way, the WHO states that only 77 million adults in India have Type 2 Diabetes, but maybe that's due to them using a different method.