518
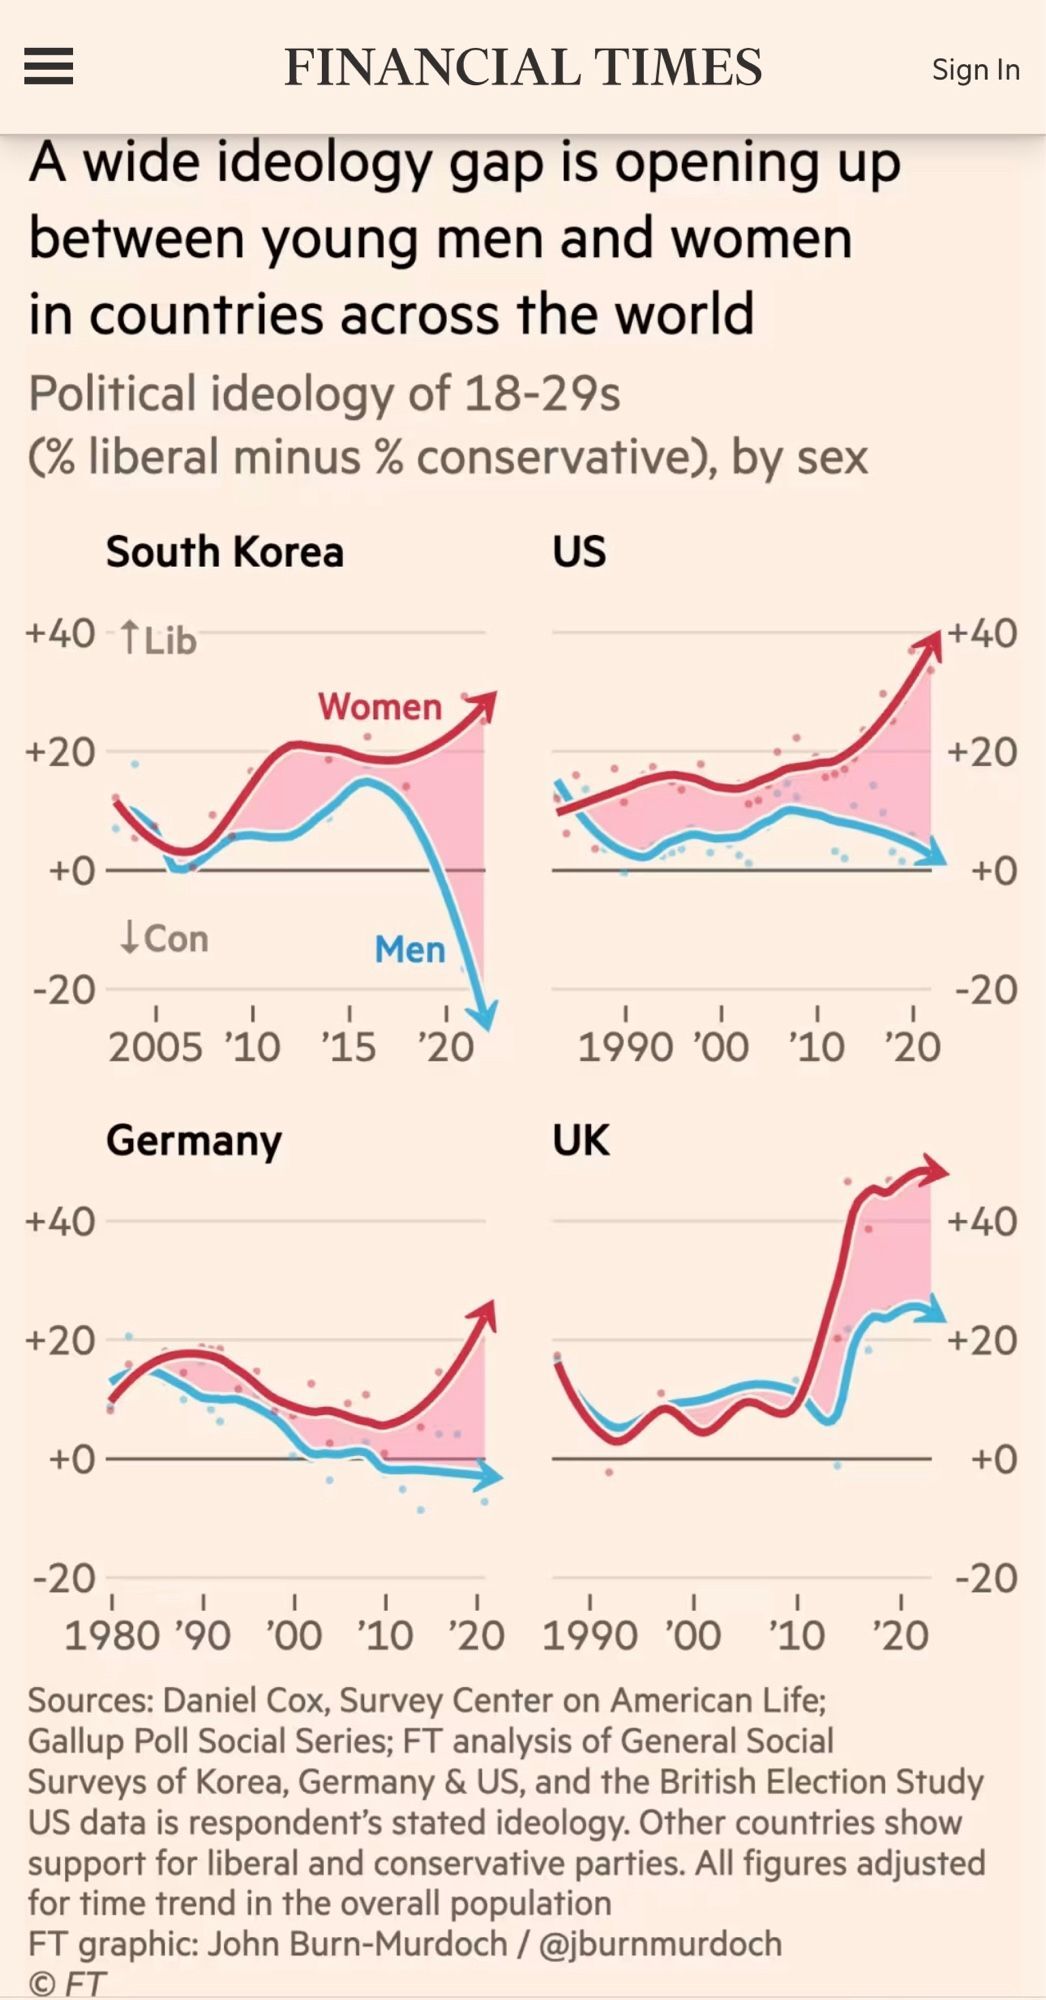
New gender gap
(lemmy.ml)
A place to share and discuss data visualizations. #dataviz
(under new moderation as of 2024-01, please let me know if there are any changes you want to see!)
It’s only beautiful in that is well visualized. The data itself is scary.
The graps don’t represent the same amount of time while they are there for comparison. I wouldn’t call that well visualized.
South Korea is expanded, which reduces the appearance of disparity. Germany has an extra 10 years. But despite those issues the data is still compelling.
I wouldn’t call it well visualized. Is looks like it’s measuring the same data in each graph, which is extremely misleading because “liberal” and “conservative” have very different meanings in each country’s politics.